HAWAII VOLCANOES NATIONAL PARK — Since the early 1990s, scientists have used radar satellites to map movement, or deformation, of Earth’s surface. Interferometric Synthetic Aperture Radar calculates the difference between two radar images acquired by an orbiting satellite taken at different times but looking at the same place on Earth. This difference is called an interferogram, and is essentially a map of surface deformation.
Deformation is one of the main ways that the Hawaiian Volcano Observatory monitors activity of Hawaii’s volcanoes. Volcanoes can change their shape as magma moves in and out of their plumbing systems, as their slopes shift on faults or because of gravity, and when they have internal changes in pressure. Interferograms, together with GPS and tilt, help HVO scientists keep many eyes on a volcano when it’s getting bent out of shape.
Interferograms cover large areas of land — the entire Island of Hawaii can fit into a single radar scene — and provide centimeter-scale accuracy of ground motion. This means seeing changes of less than half an inch from space! However, interferograms can be tricky to read. This Volcano Watch will guide you through interpreting an interferogram, as well as explain how they are produced.
The difference in the distance to the ground between two satellite passes, known as the interferometric phase, is shown as fringes, or bands, of color in an interferogram. This difference includes deformation of the surface that occurred between passes, but it is also influenced by uncertainty in satellite orbits, topographic ambiguities, atmospheric conditions, and other sources of error. These all contribute to the interferometric phase. To get at the true movement of the ground, you have to compensate for these sources of error.
The first step in reading an interferogram is to determine “when” and “what.” The dates of each image answer the question of “when” the deformation occurred. Different satellites use different wavelengths, and that controls the amount of ground deformation represented per colored fringe — the “what.”
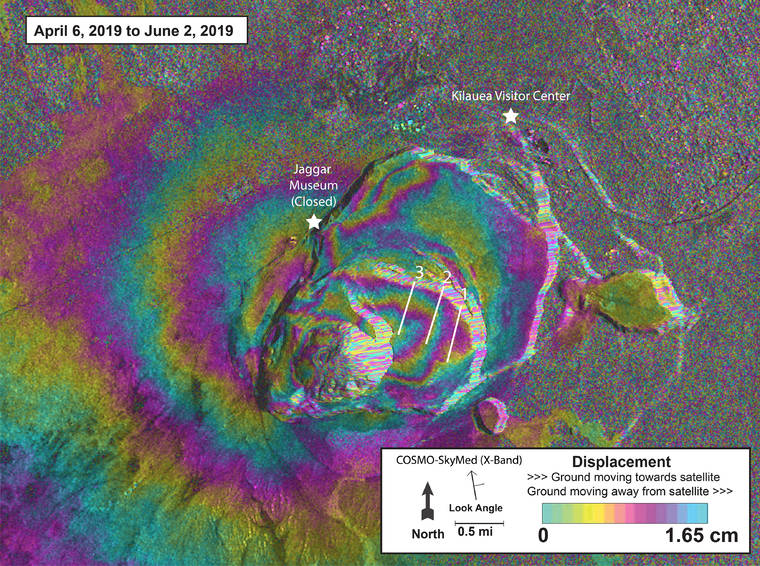
In the interferogram shown here, the satellite used is the Italian Space Agency’s COSMO-SkyMed (CSK) system. The radar wavelength for CSK is X-band (approximately 3.3 centimeters in total length). Because an interferogram is made using radar waves that travel to Earth from the satellite and back, the deformation is calculated in terms of half the wavelength. This means that when reading a CSK interferogram, one fringe is equal to 1.65 centimeters (or 0.65 inches) of change between the two dates.
Step two is to count the colored fringes to determine the amount of deformation shown in an interferogram. Volcanic deformation is often concentric in shape, so start on the outside of the fringe pattern and count the number of color cycles from the edge of the deformed area to the center. Multiply the number of colored fringes by the half wavelength to determine the magnitude of the deformation.
Step three is to determine if the surface moved up or down. To do this, as you count fringes from the outside to the inside of a concentric pattern, note the sense of color changes. Does the pattern go blue-purple-yellow in towards the center, or blue-yellow-purple? The color scale at the bottom of the image reveals that blue-yellow-purple is an increasing trend, which in this interferogram, means that the ground is moving towards the satellite—it is inflating! The color sequence should always be defined on a scale bar in the interferogram, along with the half wavelength, because not all interferograms use the same color sequence, and not all radar satellites have the same wavelength.
The last step is to interpret the information you have collected. On the CSK interferogram shown here, there are three colored fringes inside Kilauea Caldera, which means that the surface within this region moved towards the satellite, or inflated, by about 4.95 centimeters (1.95 inches) between April 6 and June 2, 2019.
But remember, the colored fringes include not just displacement, but also other influences, like orbital errors and atmospheric anomalies. These sorts of anomalies are especially prevalent around tall mountains, like Mauna Loa and Mauna Kea, and areas of very steep topography, like the south flank of Kilauea. In this case, atmospheric anomalies are probably not an issue, since the area of deformation is smaller than most weather patterns.
We also compensate for orbital errors, since we know the satellite orbits very precisely. But topographic errors due to the massive changes that took place at the summit in 2018 might introduce a small amount of error to the measurement. Also, because radar satellites don’t look straight down on Earth, the deformation in interferograms is a combination of vertical and horizontal displacements, although vertical changes usually dominate.
And that’s how you read an interferometric rainbow!
Volcano Watch is a weekly article and activity update written by the U.S. Geological Survey Hawaiian Volcano Observatory scientists and affiliates.