The Feb. 3 installment of “Volcano Watch” introduced some of the data streams that are used to monitor eruption pauses and renewals at Kilauea’s summit, including ground tilt from borehole tiltmeters. Tilt data also provided valuable insight into the behavior of the lava lake that occupied Halemaʻumaʻu crater from 2008-18, before the series of collapses in 2018 changed Kilauea’s summit topography.
In 2008, a short series of explosions preceded the opening of a lava lake in the “old” Halemaʻumaʻu crater. The lake grew steadily, forming what became known as the Overlook crater. Convection of lava within the lake provided a steady supply of sulfur dioxide (SO2), which was the main contributor to vog (volcanic air pollution) in Hawaiʻi. It also provided a reliable glow against the night sky that was visible throughout the summit region.
When lava began erupting from fissures in Leilani Estates in 2018, Kilauea’s summit reservoir system began to deflate, and the lava lake quickly drained away before the summit began to collapse.
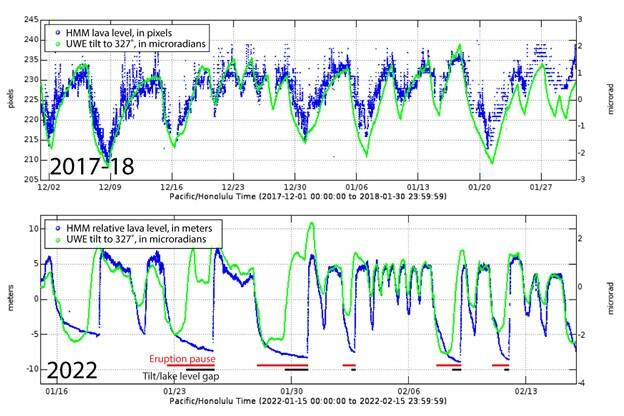
One of the interesting facets of the 2008-18 lava lake era was the close association between summit tilt data and the surface level of the lava lake. As the lake surface would rise within the Overlook crater, summit tiltmeters would record inflationary tilt. As the lava lake surface withdrew, tiltmeters would record deflationary tilt.
The interpretation was that there was a fully open connection between the lava lake and the shallow summit magma reservoir, referred to as the Halemaʻumaʻu reservoir. As a result, the lake acted like a barometer, with its level moving up and down in direct proportion to pressure changes in the Halemaʻumaʻu reservoir.
This unique behavior made it possible to determine certain quantities for the Halemaʻumaʻu magma reservoir that are difficult or impossible to determine at other volcanoes. For example, it is easier to track magma chamber volume changes than to determine the overall volume, but the open nature of the 2008-18 lava lake also made this calculation possible.
In a 2019 publication, scientists showed that by tracking deformation and lava level changes during the opening stages of Kilauea’s 2018 summit collapses, it was possible to determine that the entire 2018 collapse and eruption decreased the Halemaʻumaʻu magma reservoir volume by a most likely amount of 20%, leaving the majority of the magma in place.
The current lava lake in Halemaʻumaʻu also rises and falls together with inflationary and deflationary tilt. This indicates that, to some extent, there is again an open connection to the shallow Halemaʻumaʻu magma chamber. However, some of the deflation and inflation cycles are larger than others, and during these episodes the lava lake level goes down and the eruption pauses. The eruption doesn’t resume, and the lake level doesn’t rise again at the same time as the tiltmeters show inflationary tilt, but instead waits until the amount of inflationary tilt is about equal to the amount of preceding deflationary tilt.
As the Feb. 3 Volcano Watch stated, this gives us a rough idea of when the eruption pause might be over and active lava will return to the crater, allowing for an amount of forecasting that isn’t usually possible. The gap in time between the return of inflationary tilt and eruption renewal is also an indication that the connection between the surface and shallow HMMHalemaʻumaʻur eservoir isn’t always open. While the summit is inflating, pressure is building in the reservoir, and it isn’t until the eruption starts again that the pressure is released. After this the system equilibrates and once again behaves as an open system, like it did in 2008-18.
This is an interesting and important difference between the current lava lake and the lake that existed from 2008-18 and presents the opportunity to learn more about the conditions under which the system might change from closed to open.
The current overall trend of Kilauea’s summit magma system is slow deflation. This means there are no signs right now that the eruption could get more vigorous, and this regime of intermittent pauses and renewals could continue for a while. Without any changes, there may even be a time when there isn’t enough pressure left to drive the current eruption. However, Kilauea Volcano rarely goes without change for long, so we will be sure to stay attentive and prepared for the unexpected.
Volcano Activity Updates
Kilauea volcano is erupting. its USGS Volcano Alert level is at WATCH. Kilauea updates are issued daily.
Over the past week, lava has continued to intermittently erupt from the western vent within Halemaʻumaʻu crater. All lava is confined within Halemaʻumaʻu crater in Hawaii Volcanoes National Park. Sulfur dioxide emission rates remain elevated and were last measured at approximately 2,500 tonnes per day (t/d) on Feb. 25, during eruptive activity.
Mauna Loa is not erupting and remains at Volcano Alert Level ADVISORY. Mauna Loa updates are issued weekly.
This past week, about 50 small-magnitude earthquakes were recorded below the summit and upper elevation flanks of Mauna Loa — the majority of these occurred at shallow depths less than 6 miles below sea level.
Five earthquakes were reported felt in the Hawaiian Islands during the past week: a magnitude-3.0 earthquake 20 miles west-northwest of Kalaoa on March 2 at 10:40 a.m., a magnitude-3.1 earthquake 2 miles southwest of Pahala on March 2 at 10:11 a.m., a magnitude-3.3 earthquake less than a mile northeast of Pahala on Feb. 27 at 10:01 p.m., a magnitude-2.8 earthquake 8 miles southeast of Waimea on Feb. 25 at 7:30 p.m., a magnitude-3.1 earthquake 8 mi south-southeast of Fern Forest on Feb. 25 at 2:50 p.m.
Visit https://www.usgs.gov/observatories/hawaiian-volcano-observatory for past Volcano Watch articles, updates, photos, maps, recent earthquake info, and more. Email questions to askHVO@usgs.gov. Volcano Watch is a weekly article and activity update written by USGS Hawaiian Volcano Observatory scientists and affiliates.