Volcano Watch: Tilt measurements still vital to volcano monitoring after more than a century

Measuring how a volcano deforms in response to moving magma is one of the cornerstones of volcano monitoring. Our instrumentation includes a number of newer, satellite-based methods but another important instrument has been around a lot longer: the tiltmeter.
Tilt data was the first geodetic data collected by the Hawaiian Volcano Observatory (HVO) and continues to be incredibly important both for monitoring and basic research in volcano behavior.
In the early 20th century, scientists were only beginning to recognize that volcanic eruptions (and earthquakes) were accompanied by “topographic changes” (as they were called at the time). In Japan, one of the forebearers of seismology, Dr. Fusakichi Omori, realized that the boom arm on his seismometer affected by ground tilt and that this annoyance was important data.
In 1917, Dr. Thomas Jaggar began tracking tilt changes at Hawaiian volcanoes. At first, by looking at the deflections of the HVO’s Omori and Bosch-Omori seismometers. Later, by constructing specially designed “clinoscopes.” These provided a rough idea of the amount of tilt over the span of a day to a week.
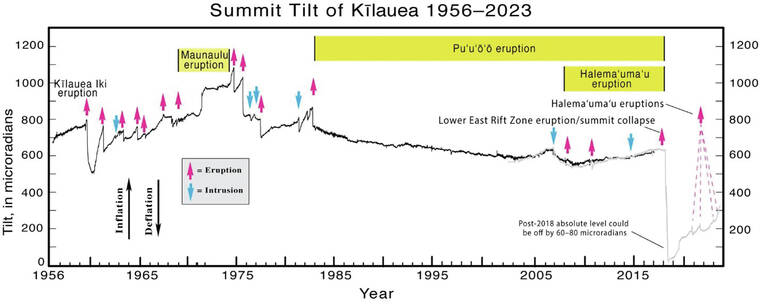
In the 1950s, HVO scientist Dr. Jerry Eaton designed an improved tiltmeter using water. This apparatus provided a precise tilt measurement to be used to track daily or even hourly tilt. The “water tube tiltmeters” allowed HVO scientists to track the movement of Kilauea’s summit through several eruptions, providing a continuous record of inflation and deflation.
The water tube tiltmeter consists of three “pots” of water connected by tubes such that the water can freely flow between them. One pot is placed in the center, and the other two are placed east and north of the center pot. The water in the tubes will always seek to be level, but when the ground tilts and moves the pots up or down, it will look like the water level is moving down or up. By reading the depth of the water in each pot, one can work out how much the ground has tilted since the last reading.
Water tube tilt data was especially valuable because it could be collected regularly to form a continuous time series. This means data was collected whether it seemed important in the moment or not. This kind of continuous record facilitates discoveries that wouldn’t be possible if data was only collected during eruptions.
In particular, the water tube tiltmeters showed cycles of steep inflationary tilt between eruptions and then sudden deflation as eruptions drained magma chambers. However, once Pu‘u‘o‘o began erupting on Kilauea’s middle East Rift Zone in 1983, these cycles became much more subdued.
In the early 1970s, electronic tiltmeters began to be installed around Kilauea. These instruments are installed in boreholes about 16 feet (5 meters) deep, such that they are protected from the weather, and can provide tilt measurements down to a fraction of a microradian every minute.
After the end of the Pu‘u‘o‘o eruption in 2018, the character of tilt at Kilauea’s summit changed again. Electronic tiltmeters began to record steep inflationary tilt, not too different from the rates observed by the water tube tiltmeter in the 1950s-1970s. Major eruptions, similar to Kilauea Iki or Maunaulu — which resulted in large summit deflations — have not occurred recently, but the similarity of the current records to those from the 1950s-1970s is yet another sign that Kilauea is not too different now from how it was before the 2018 eruption.
This means that the data collected, and the lessons learned about Kilauea’s plumbing, are still applicable today. Scientists can still use Kilauea’s past behavior to make forecasts about future behavior and test out new ideas for what may have happened in the past.
For example, currently the tiltmeter at Uekahuna bluff (UWE) is not showing major tilt changes, but another tiltmeter south of Kilauea’s caldera (SDH) has shown a steep increase over the past couple weeks. By looking back at past records, scientists recognize that this is likely due to magma accumulation in a South Caldera reservoir, which occurs intermittently; most recently in 2015 and 2021.
The long and faithful recording of tilt at Kilauea gives scientists a boost to understanding current processes and could facilitate new discoveries about the past.
Volcano Activity Updates
Kilauea is not erupting. Its USGS Volcano Alert level is ADVISORY.
Over the past week, elevated earthquake activity continued in an area south of Kilauea’s summit caldera. Kilauea summit tiltmeters suggest that the area south of the caldera is inflating — independent of the usual deformation source inside the caldera. Within the caldera, there has been minor net inflation over the past week. A sulfur dioxide (SO2) emission rate of approximately 75 tonnes per day was measured on August 24.
Mauna Loa is not erupting. Its USGS Volcano Alert Level is at NORMAL.
Webcams show no signs of activity on Mauna Loa. Seismicity remains low. Summit ground deformation rates indicate slow inflation as magma replenishes the reservoir system following the recent eruption. SO2 emission rates are at background levels.
No earthquakes were reported felt in the Hawaiian Islands during the past week.
HVO continues to closely monitor Kilauea and Mauna Loa.
Please visit HVO’s website for past Volcano Watch articles, Kilauea and Mauna Loa updates, volcano photos, maps, recent earthquake information, and more. Email questions to askHVO@usgs.gov.
Volcano Watch is a weekly article and activity update written by U.S. Geological Survey Hawaiian Volcano Observatory scientists and affiliates.
